Resolutions for a New Year of Vulns
• Mike Shema
Throughout 2017 I explored vuln data to highlight strategies for measuring and maximizing the efficiency of vuln discovery. The primary themes were budget and time — deciding how best to allocate money among different approaches plus evaluating the triggers and frequency of security testing. I was fortunate to present much of this at various conferences, which gave me a chance to collect feedback and engage in interesting discussions about the challenges that DevOps teams face.
In 2018 I’ll have even more data with more dimensions to explore. While it’s important to lay out a strategy for finding vulns in an app. Knowing what risk an app has is only the start. Reducing that risk is the important next step. Strategies for resolving vulns will be a new theme for the new year.
Resolving vulns relates to a trope along the lines of, “Show me your budget and I’ll tell you what you value.” This applies to time as well as money. The vulns you choose to fix and the speed with which you fix them reflect an investment in security. Ideally, it also reflects an understanding of risk.
As a teaser of the content coming next year, here’s a graph that reflects how an organization resolves vulns. It shows the deviation in resolving a specific category of vuln from the average resolution time across all vulns. Fewer days represents a faster fix, greater days a longer one.
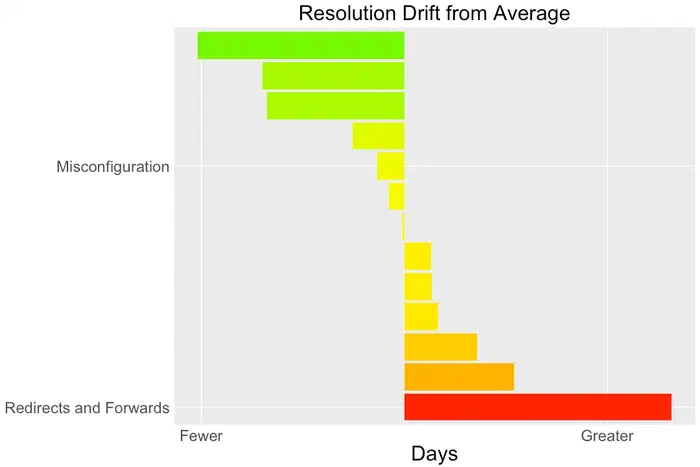
In this graph, vulns due to misconfigurations are resolved close to the average, whereas redirects and forwards languish in the DevOps queue for quite a while longer.
We can follow many paths of discussion from a graph like this. Several things influence the speed of fixes, from complexity of code to risk they carry. In the case of redirects and forwards, it seems fair to guess that such vulns represent little or no risk — a hypothesis further reinforced by the category disappearing from the recent OWASP Top 10 update. (We’ll also examine how prevalence of a vuln type impacts its resolution.)
I haven’t even noted what the average number of days is. In a way, it doesn’t matter. The vuln category at the top of the graph clearly receives more attention than the two I’ve labeled. In other words, DevOps teams have a clear priority for such vulns. That’s one indicator of the distinction of BugOps vs. DevOps. Even better is if that category were to completely disappear over time.
It will still be important to discuss threat models and how they help measure risk, especially working with clear, well-considered models instead of falling into counterproductive traps. From there, we’ll take a view of the risk we measure and explore the different ways to reduce it.
This year has only a few days left. A few days left should be the typical response to fixing vulns. Come back next year to find out what new vuln data says about those few days.